
A project can look busy while its time record tells you very little. “Client work — six hours” does not explain which task moved forward, how much of the work was billable, or whether the team is approaching its budget. Useful time tracking connects the hours to the work and makes the totals easy to review.
Wave Time Tracking brings personal time entries, team timesheets, project settings, and time reports into one workspace. Record a duration or use a timer, attach the entry to a project and task, and review the results by company, project, task, or teammate. This guide covers the current tracking, management, and reporting features.
Watch the Wave Time Tracking showcase
The 48-second showcase uses actual Wave UI components with fictional data from Northstar Studio. Six teammates have 54 entries across three projects and nine tasks for November 16–18, 2026. The sample totals 126 hours: 108 billable and 18 non-billable. The Customer Portal project accounts for 63 hours against an 80-hour budget.
All people, clients, entries, rates, and results are illustrative. The presentation runs separately from production and uses Wave's actual timesheet and reporting calculations. No production time entries, timers, rates, or project settings were changed.
What is Wave Time Tracking?
Wave Time Tracking helps people record their work and gives authorized managers a way to review it. My Time contains day and week views. Reports summarizes the hours and provides routes into more detailed analysis. Manage brings together team timesheets, project configuration, and time-tracking activity.
In the example, Northstar is delivering a Customer Portal for Aster Labs, a Customer Onboarding project for Orion Works, and its own Studio Operations work. Keeping those activities separate makes the report useful: the team can see delivery time, internal effort, and the entries behind a project's total.
Record time against the actual work
1. My Time with day and week views
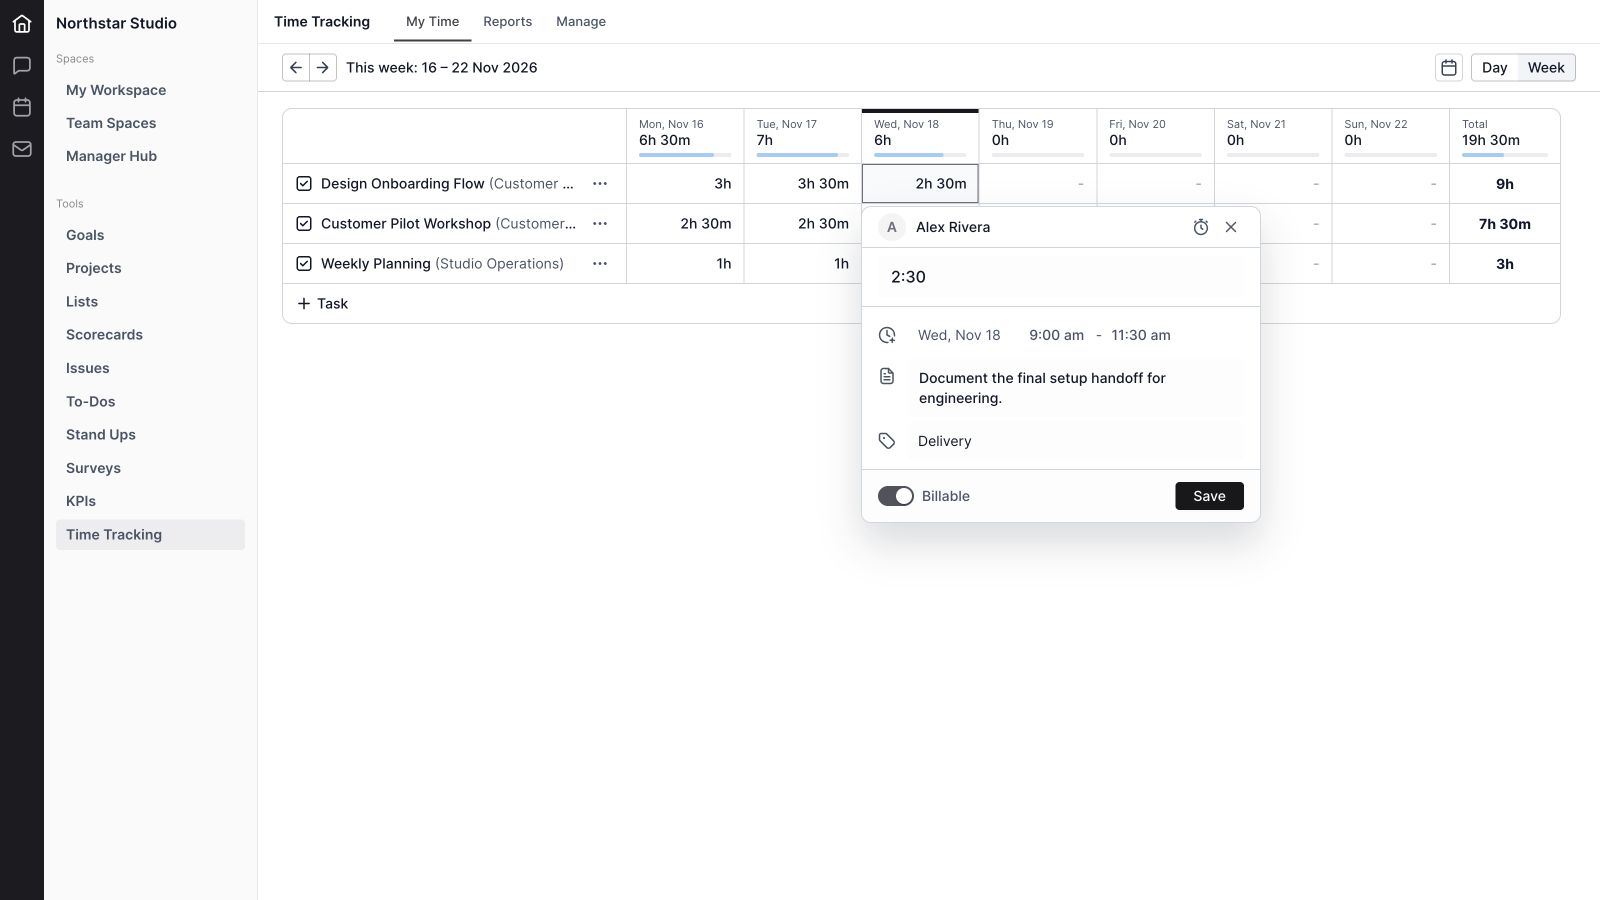
Switch between Day and Week to review the same work at different levels. Week places tasks in rows and dates in columns, with daily and row totals. Day shows more entry detail, including notes, billable status, labels, start time, end time, and tracked time.
2. Project and task selection
Add Task connects a timesheet row to a project and a task. The project name remains visible beside the task, helping distinguish similar work for different clients. Northstar separates Design onboarding flow in Customer Portal from Customer pilot workshop in Customer Onboarding.
3. Adding several task rows
The task picker offers tasks from the selected project. Add More keeps the add-task workflow open when several rows need to be prepared. Select a different project or task for the next row, and use clear task names so the report remains understandable after the work is finished.
4. Manual duration entry
Enter tracked time directly when you know how long the work took. The duration handling supports hours-and-minutes values and decimal hours. For example, 2:30 and 2.5 both represent two hours and thirty minutes; 2:30 does not mean 2.3 hours.
5. Start and end times
Entries can include a start and end time. Wave normalizes the values and can calculate duration from a valid time range. The editing flow checks that the end is not earlier than the start, helping catch a reversed or incomplete range before it becomes a misleading total.
6. Notes on each entry
Notes explain what happened during the recorded time. A useful note identifies an outcome, decision, or piece of work, such as “Document the final setup handoff for engineering.” Those notes appear in the day view and detailed reports, where someone may need to understand an entry later.
7. Billable and non-billable time
The Billable control classifies an entry for reporting. A client workshop can be billable while internal planning is non-billable. The distinction carries into totals and report breakdowns, so internal work stays visible without being counted as billable client delivery.
8. Time-tracking labels
Labels add a consistent classification to individual entries. Northstar uses Delivery, Customer Work, and Internal to make the purpose visible at a glance. The day view includes a label control, and the week entry editor lets someone adjust the label alongside the duration and notes.
9. Calendar and period navigation
Previous and Next controls move through the selected day or week, and the calendar lets you choose a date. The week view shows the full Monday-to-Sunday range. Future or unused days can remain empty; they are not evidence of missing work simply because the current week is still in progress.
10. Starting a timer from an entry
The week entry editor includes Start Timer. Choose the work and its context before starting so the elapsed time belongs to a recognizable task. The control also accounts for an existing active timer, helping the user understand when another timer is already running.
11. An active timer in the navigation
A running timer remains accessible in Wave's navigation, with an elapsed clock and a stop control. This lets someone move around the workspace while keeping the timer within reach. The demo shows the actual timer component with an illustrative 45-minute running session, separate from the completed-entry totals.
12. Inline editing and the week entry editor
Use inline cells for quick changes or open a week's time cell for its fuller editor. The editor brings together the person, date, duration, time range, notes, label, and billable status. Reviewing those details together makes a correction easier to understand than changing a total in isolation.
13. Reordering task rows
The week view supports dragging task rows into a useful order. Put the work you return to most often near the top or arrange tasks around the day's delivery flow. Row order is a presentation choice; it does not change the hours recorded against the tasks.
14. Removing rows and reusing the recent row
Row actions include Remove Row, and the empty-state workflow can offer Reuse Recent for the most recently removed row. These controls help manage the working timesheet. Reuse Recent should not be confused with an automatic copy of the previous week's completed time.
15. Selecting entries in the day view
The day table includes row selection and a bulk deletion workflow. It is useful when several incorrect entries need the same cleanup. Review the selected tasks and dates carefully before deleting records, especially when their hours already appear in a report someone is using.
Review the week and the team's capacity

16. Daily and weekly totals
The week view shows a total for each date, each task row, and the week. The day view also shows its tracked-time total. In the sample, Alex Rivera has 19 hours and 30 minutes across the three populated dates, while the complete six-person dataset totals 126 hours.
17. Capacity indicators and breakdowns
Capacity indicators compare tracked time with available time. Their breakdown includes tracked, billable, non-billable, remaining, and over-capacity amounts where applicable. Capacity can come from the timesheet data or the member's working schedule. It provides context for the hours; it is not a measure of an individual's productivity.
18. Team timesheets in Manage
Manage → Timesheets presents members in rows and the selected week's dates in columns. Daily totals and a weekly total make it easier to review coverage across the team. Northstar's sample has six active teammates with different daily durations, making both individual and team totals visible.
19. Opening a member's timesheet
A manager can open a member from the timesheet list to review that person's entries in detail. The selected member's name stays in the page context. This supports a practical follow-up: move from an unexpected total to the specific work, date, and notes behind it.
20. Role-based management and report access
The inspected access controls make management and reports available to authorized administrators and managers. Other members use My Time for their own tracking. Which views someone can open depends on their organization role, so a teammate's navigation may differ from the manager's showcase.
Set up the projects behind the hours

21. A project management table
Manage → Projects lists each project with its rate type, associated company, and tracked hours. The sample separates a Time & Materials portal project, a Fixed Fee onboarding project, and Non-Billable studio operations. This gives a manager a useful starting point before opening an individual project.
22. Project details and company association
The project drawer shows context such as name, status, priority, teams, owner, and dates. Its supported time-tracking property controls include Company Project or Internal Project and the associated company. Some other project properties are shown for reference and are read-only in this drawer.
23. Three rate types
The Rate Type section offers Time & Materials, Fixed Fee, and Non-Billable. Select the model that describes the project. The choice helps organize tracking settings, but a time report by itself is not an invoice or proof that the client has paid.
24. Project and member billable-rate sources
Time & Materials settings include Project Billable Rate and Member Billable Rate source choices. A project rate provides a common amount for that project's work. In the demo, Customer Portal uses a $150 project rate. Confirm the saved rate configuration before relying on a report's monetary amounts.
25. A fixed-fee amount
Fixed Fee settings let the project carry an agreed fee while the team continues tracking hours. This keeps the commercial setup and the effort record in the same project context. Northstar's fictional onboarding project has a $12,000 fee, while its time entries remain available for review.
26. A budget in project hours
Set a Total Project Hours budget to give the team a planning reference. Customer Portal has an 80-hour budget and 63 tracked hours in the sample. That arithmetic leaves 17 hours, or 21.25% of the budget. Use the underlying entries to understand what remains to be delivered before making a scheduling decision.
27. Monthly budget reset settings
The Budget resets every month option distinguishes a recurring monthly allowance from a total project-hours budget. The surrounding labels change to reflect the selected mode. Choose the mode deliberately so the team does not compare one month's work with a budget intended for the entire project.
28. Budget notification thresholds
The project settings include Send notification if exceeds and a percentage threshold. The form validates the threshold before saving. Northstar's example uses 80%. The showcase demonstrates the configuration; it does not test notification delivery or create a real budget alert.
29. Time-tracking activity
Manage → Activity provides a feed filtered to time-tracking activity. It gives authorized users a place to review recorded events in context. What appears depends on the activity recorded by the workspace; an empty feed is different from a timesheet with zero tracked hours.
Understand where the hours go

30. Total, billable, and non-billable hours
The Reports overview summarizes total hours and splits them into billable and non-billable work. Northstar's sample contains 126 total hours, with 108 billable and 18 non-billable. The split makes internal effort visible alongside client delivery instead of hiding it from the review.
31. Billable hours over time and task distribution
A billable-hours chart shows the daily pattern in the selected period. A task chart shows where the tracked hours are concentrated. Read the date range before interpreting a drop: in the demo, Thursday through Sunday are empty because the sample contains Monday through Wednesday entries.
32. Company, project, task, and member breakdowns
The four breakdown tabs let you answer different questions using the same entries. Companies shows where client work sits; Projects shows the delivery effort; Tasks identifies the work consuming time; Members shows each person's recorded contribution. Rows include hours, billable hours, and billable amounts where available.
33. Billable amounts from entry rates
The current summary calculation uses an entry's billable-rate snapshot and duration. Customer Portal's 63 billable hours at $150 produce $9,450. The sample totals $15,075 across its billable entries. This is a time-report amount; it does not replace the separate fixed-fee setting, an invoice, or a payment record.
34. Reporting periods and navigation
Reports offers Week, Semimonth, Month, Quarter, Year, and All time periods, with navigation for the applicable range. These let a manager move from a current delivery review to a broader period. A Custom option is visible, but the inspected implementation currently follows the week range rather than providing an independent custom-date selector.
35. Drilling into a company, project, task, or member
Selectable breakdown rows open a report scoped to that resource. From the project summary, open Customer Portal to focus on its work rather than the whole organization. The available breakdown tabs adjust to the selected scope, keeping the next level of detail relevant to the question.
36. Project progress and weekly hours charts
Project-scoped reports include a chart that switches between cumulative project progress and hours per week. The current chart uses a 12-week window. It helps show whether effort is steady, accelerating, or concentrated in particular weeks; the cumulative figure reflects the displayed window rather than an unlimited project history.
37. Creating a detailed report with filters
The + Report flow lets you choose a timeframe, company, project, task, and member, with an option to include archived items in filters. Run Report opens the detailed view. The sample selects Customer Portal and shows its 63 hours separately from the team's 126-hour total.
38. Detailed rows, grouping, and display controls
The detailed report shows company, project, task, notes, role, person, and hours. Display controls select all hours, billable only, or non-billable only; group by Date, Company, Project, Task, or Member; and limit the view to active projects. Filters and grouping serve different purposes: filtering chooses the entries, while grouping organizes the selected results.
39. Downloading the detailed report as a PDF
The detailed report's More actions menu includes Download PDF. Its export uses the current report title, totals, filters, display choices, and rows. This is the supported detailed-report download path. The separate Export PDF item in the summary table's menu is currently a placeholder and should not be treated as a working export.
A practical review using the sample data
Northstar can start its delivery review with three questions: where did the hours go, how much was billable, and which project needs attention? The report shows 108 of 126 hours classified as billable, displayed as 86% after rounding. Customer Portal has 63 hours, Customer Onboarding has 45, and Studio Operations has 18.
- Review the totals in context. Check the dates and distinguish the current partial week from a completed week.
- Open the project that needs attention. Compare Customer Portal's 63 recorded hours with its 80-hour planning budget.
- Read the detailed entries. Look at the tasks, owners, and notes before changing an estimate or delivery plan.
- Agree on the next action. Decide whether to narrow scope, remove a blocker, or adjust the remaining work.
- Keep the follow-up connected. Record the decision where the team manages the delivery work.
Use Wave Projects for the delivery plan, Wave Lists for structured work, and Wave To-Dos for owned follow-ups. Wave Directory provides teammate context, while Wave KPIs supports a separate view of business outcomes. Hours describe recorded effort; they should be considered alongside the result of the work.
Current details to understand before relying on a report
The feature guide distinguishes working controls from visible options that are not complete. Custom reporting periods currently use the week range. Use the detailed report's Download PDF action, because the summary-menu export is a placeholder. The member summary includes a Utilization column, but the inspected adapter does not yet populate it with a calculated percentage.
The rate form exposes member-rate controls, but the inspected save payload does not send individual member-rate edits. Do not assume those edits were stored without confirming the saved configuration. Budget reset and notification controls are present; this showcase does not verify a real reset or notification being delivered. Payroll, invoicing, automatic timesheet approval, and background activity monitoring are not demonstrated features of this workflow.
Wave Time Tracking frequently asked questions
What is Wave Time Tracking used for?
It records time against projects and tasks, organizes personal and team timesheets, and reports hours by company, project, task, or member. Authorized managers can also configure project rates and hour budgets.
Can I enter time manually and use a timer?
Yes. You can enter a duration or a valid start-and-end range. The week entry editor also provides Start Timer, and an active timer has an elapsed display and stop control in the navigation.
Can I separate billable and internal work?
Yes. Entries carry a billable flag, and reports distinguish billable from non-billable hours. The detailed report can show all hours or filter to either classification.
Can managers review everyone's timesheets?
Authorized administrators and managers can use Manage → Timesheets and open individual member timesheets. Availability depends on the account's organization permissions.
Does a billable amount equal an invoice total?
No. The report calculates amounts from billable entry durations and stored rate snapshots. A fixed fee is a separate project setting, and invoicing or payment status is not established by the time report.
Can I set an hour budget and notification threshold?
The project settings include a total-hours budget, a monthly reset option, and a percentage notification threshold. The demo shows the controls with fictional settings and does not test notification delivery.
Can I export a time report?
The detailed report supports Download PDF with its current filters and rows. Use that path; the summary table's Export PDF menu item is currently a placeholder.
Does the showcase contain real employee or client records?
No. It uses actual Wave UI components with fictional people, clients, projects, entries, rates, and budgets in an isolated presentation. No production tracking records or settings were changed.
Make the time record useful
A good time record should help the team explain its work. Wave Time Tracking connects the duration to a task, gives the entry context, and carries that information into timesheets and reports. Start with clear task names and useful notes, then review the totals against the work still to deliver.
Get started with Wave or explore the workspace at ourwave.io.


