Wave KPIs brings business metrics, monthly targets, and clear ownership into the same workspace your team uses to get work done. See the current result, compare it with the goal, inspect the monthly trend, and keep the explanation beside the number.
This guide covers the Wave KPIs tool: KPI groups, supported data sources, metric setup, cards, reports, monthly tables, history, collaboration, and administration. Watch the showcase first, then use the feature guide to plan your own performance review.
Watch the Wave KPIs showcase
The video uses actual Wave interface components in a prepared sample workspace. Northstar Studio, its teammates, financial figures, targets, and review notes are fictional. The example contains 12 KPIs and 319 recorded observations; it illustrates the interface rather than a live integration sync.
What is Wave KPIs?
Wave KPIs is Wave’s tool for reviewing indicators from supported Wave tools and connected services. A KPI combines a selected source metric, an owner, a monthly goal, and the condition that defines the target. KPI groups organize those indicators around a team, business function, or review.
For example, a company performance group can bring revenue, expenses, completed tasks, new contacts, meeting ratings, and stand-up completion into one review. Each indicator keeps its own unit and calculation method, so a revenue total, a task snapshot, and an average rating retain their different meanings.
Use Wave KPIs when you want to review available source metrics against goals. Use Wave Scorecards for recurring measures and checks your team defines and records. Use Wave Goals to organize the objectives and milestones those numbers support.
Organize your KPI workspace
1. KPI groups
Create groups for the reviews your team actually runs: company performance, product delivery, customer growth, or revenue operations. A group provides a shared home for related indicators, without requiring every metric to come from the same source. Group names, icons, and cover settings help make each review recognizable.
2. A group overview
The KPIs landing page lists groups with their health, priority, owner, and status. This gives a team lead a starting point for deciding which review needs attention before opening individual metrics.
3. Favorites
Favorite the groups you return to regularly. Favorite cards put those groups near the top of the workspace, helping a weekly leadership review or a monthly operating review start in a familiar place.
4. Search, filters, and display controls
Search for a group and narrow the overview using its available filters, including owner, priority, and status. Display controls let you manage the favorites area. Inside a group, available KPI filters help focus the review on a smaller set of indicators.
5. Group owners and teams
Assign an owner to the group and associate the relevant teams. The group owner coordinates the review; individual KPI owners remain responsible for explaining their own metrics. Those two levels of ownership serve different purposes.
6. Group status and priority
Use group status to describe the lifecycle of the work and priority to communicate its importance. A planned group for the next quarter can sit alongside an active operating review without suggesting that they are at the same stage.
7. Group health updates
Post a health update with the context behind the group’s condition. A short explanation—such as a renewal delay or an improving delivery trend—makes the health indicator more useful than a color alone.
Choose the right source and metric
8. Data-source selection
KPI creation starts with a data source. Available options depend on the tools enabled in the workspace and the integrations connected to it. Select the source first, then choose from that source’s supported KPI catalog.
9. Metrics from Wave tools
Supported built-in catalogs cover operational areas such as Projects, Goals, CRM, Lists, Scorecards, Meetings, Stand Ups, Knowledge, News, Directory, and Surveys. Examples include completed tasks, completed milestones, new contacts, meeting counts, average meeting ratings, and stand-up completion or block rates. The choices shown in your workspace are the authoritative list for that setup.
10. Metrics from connected services
Connected-service catalogs include Stripe, QuickBooks, Google Analytics, Instagram, Intercom, Twilio, and YouTube. These are conditional options: the relevant service must be connected and available in the workspace. The showcase uses prepared Stripe revenue and payment figures and QuickBooks expense figures.
11. Source-specific KPI definitions
Choose a defined metric rather than giving an arbitrary number a new label. For Projects, for example, the catalog includes project counts and completed or incomplete task and subtask counts. This keeps the meaning of the indicator tied to its source.
12. Appropriate units and aggregation
Metrics use the number, currency, or percentage format defined for that KPI. Calculation also follows the selected metric: some values are summed, some use a latest snapshot, and others use an average or an average rate. Aggregation is part of the metric definition, rather than a switch that changes what the KPI means.
13. A focused creation flow
The creation form brings together the source, KPI, goal condition, monthly goal value, owner, and destination group. A Create More option supports adding several indicators in sequence when setting up a new review.
Set targets and accountability
14. Individual KPI owners
Assign an owner who can explain the number and coordinate a response. Owners are visible from the cards, report, monthly list, and detail view, so a review can move directly from a result to the person responsible for its context.
15. Monthly goals
Set a monthly goal for each KPI. The sample revenue KPI has a $60,000 target, while completed tasks has a target of 120. A goal gives a displayed result a clear reference point.
16. Goal conditions
Choose the condition that fits the metric. A revenue target can use greater than or equal to; an expense ceiling can use less than or equal to. The form also offers greater than, less than, equal to, and not equal to. The selected rule is visible with the goal, avoiding an assumption that a higher value is always better.
17. KPI properties
Open a KPI to inspect its owner, performance status, creation date, update date, and group. The adjacent goal section shows its monthly interval, measurement type, operation rule, and target.
18. Move KPIs between groups
The KPI Group field in the detail view lets you change where the KPI belongs. This supports reorganizing a review as responsibilities change without recreating the metric solely to place it in another group.
Review results in three views
19. Card view
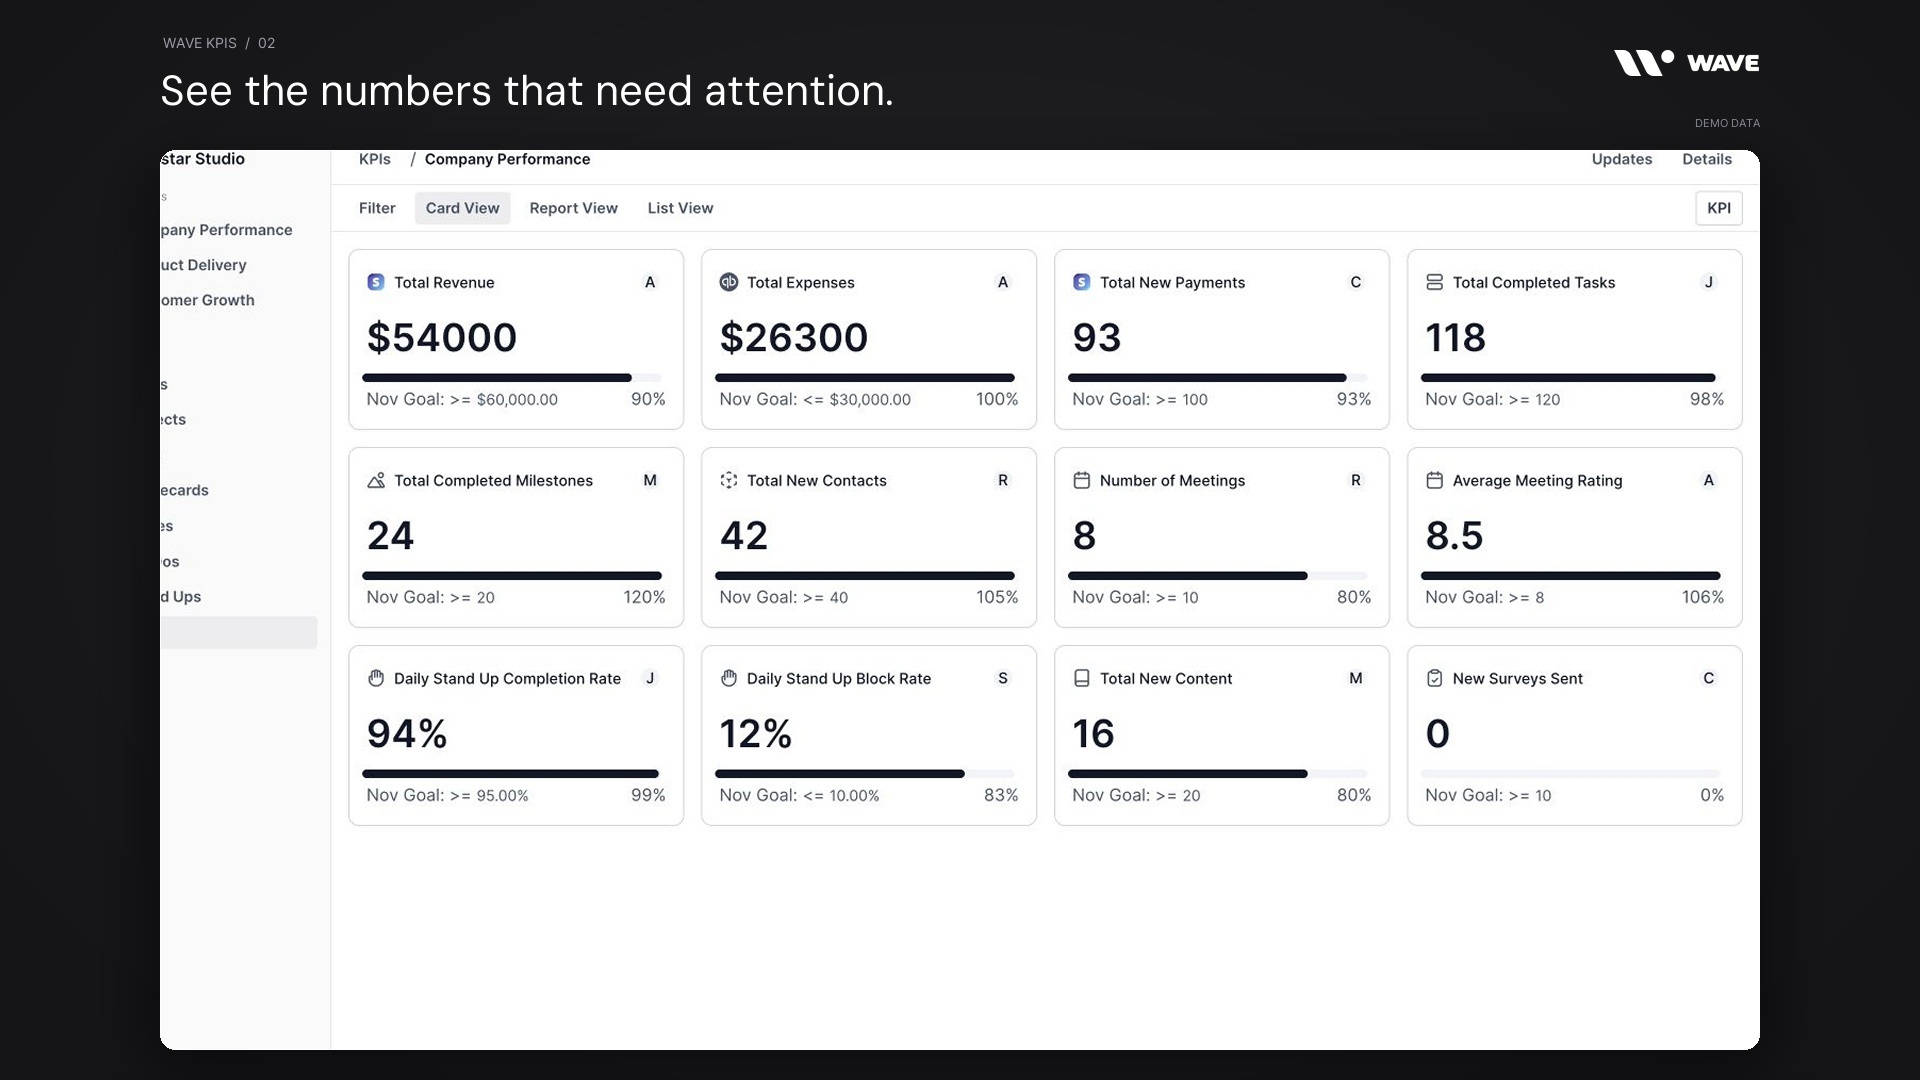
Cards put the current month’s result, source icon, owner, goal, and progress together. Use this view for a quick operating review where the first task is understanding the current position across several indicators.

20. Progress against the target
Each card displays progress against its configured goal. In the example, $54,000 is 90% of the $60,000 revenue target. Completed milestones reaches 120% of its target, while the progress bar remains visually capped. The condition matters when interpreting metrics with a maximum threshold.
21. Report view
Report view gives a selected KPI more room. Choose an indicator from the sidebar or move through the group with the previous and next controls. The chart, historical comparison, and monthly data remain together for a focused review.
22. Results and goal charts
The chart places monthly results alongside goal values. This helps explain whether the recent result reflects a sustained pattern or a single period. The sample revenue report shows the recent six-month window.

23. Historical comparison summaries
The report includes the current month and comparison positions for one, two, three, six, and twelve months ago, with percentage changes where calculated. Check that the underlying periods contain data before interpreting a comparison. An incomplete current month also needs different context from a finished month.
24. Monthly report data
Below the report, a monthly data table pairs each period’s goal with its recorded value. This provides the numerical detail behind the chart and helps a reviewer understand changes in both results and expectations.
25. List view
List view places KPIs in rows and months in columns. It is useful when you want to compare several indicators across the same periods without opening each report individually.

26. Targets, averages, and colored results
The monthly list keeps the KPI name, owner, target, and calculated average beside the dated values. Colored cells highlight performance against the goal rule. Use the values and the rule together; a status label or color is a review aid, rather than a complete explanation of business performance.
Keep the evidence and the discussion together
27. KPI Results tab
The detail drawer includes its own Results chart. You can inspect the metric’s recent results and goals while keeping the broader group in the background.
28. Dated history
History lists monthly dates, goals, and values. This is the place to inspect the period-level records behind a KPI. The interface distinguishes a missing recorded value from a populated result, which matters when reviewing a newly added metric.
29. Historical goal editing
The History table supports editing goal values for dated periods. KPI result values are read-only in this table; they represent the metric’s source data. That separation preserves the distinction between changing a target and changing the observed result.
30. Notes
Use the rich-text Notes tab to record definitions, review decisions, caveats, and the next checkpoint. In the sample, the revenue note records the current result, reminds the team that November is in progress, and identifies renewal and payment follow-ups.
31. Comments
The Comments tab gives the team a place for discussion about a specific KPI. Keep questions about an unusual result beside the indicator so the context is available during the next review. Group-level comments support discussion about the broader set of KPIs.
32. Attachments
The KPI detail view includes an attachment control for supporting media and files. Add relevant evidence when a chart needs additional explanation, such as a review document or a supporting report.
33. Activity history
Activity tabs provide a place to review recorded changes for the KPI or its group. This helps reviewers understand the surrounding work as owners, targets, and other details evolve.
34. Group owner and source breakdowns
Group details includes Owner and Sources tabs. The owner breakdown shows the distribution of KPIs across teammates. Source categories provide another way to inspect the group’s composition; their coverage depends on the supported source mapping, so use individual KPI source icons to confirm a connected-service metric.
35. Links, IDs, and navigation
KPI details exposes an identifier and navigation between items. Copy controls help reference the KPI or its containing group in a review. These references make it easier for a teammate to return to the relevant context.
36. Notifications and lifecycle management
KPI-group notification controls let you manage the available update preferences. Archive and delete actions support maintaining KPIs and groups as reporting needs change, with bulk actions available in the relevant lists. Use these controls according to your workspace permissions and retention practices.
A practical monthly review using Wave KPIs
Start with a small group of indicators that can change a decision. Northstar Studio’s fictional company performance group combines financial outcomes, delivery, customer growth, and team operating habits.
- Revenue: $54,000 against a $60,000 monthly target. The review note calls out the open renewal work and the incomplete month.
- Expenses: $26,300 against a maximum of $30,000. The goal condition makes the ceiling explicit.
- Completed tasks: 118 against a target of 120. The KPI owner supplies the delivery context.
- New contacts: 42 against a target of 40. The result starts a conversation about the quality of the growth.
- Average meeting rating: 8.5 against a target of 8. This complements the meeting count.
- Stand-up completion: 94% against a target of 95%. The block-rate KPI adds context about the work being reported.
Review the cards first. Open Report view for the indicators that need explanation. Check the dated records, ask the owner what changed, and record the decision in Notes. Use Wave Meetings for the review conversation and Wave Projects to organize the resulting work.
What to check before relying on a KPI
Confirm the selected source, metric definition, owner, goal condition, and data coverage. A missing observation is different from a measured zero, and a month in progress is different from a completed month. The source and integration determine what data is available; this showcase does not establish a real-time refresh guarantee or demonstrate a live connector synchronization.
The features and catalogs described here were reviewed against the current Wave interface and implementation on November 18, 2026. Tool availability, connected services, permissions, and configuration can affect the options shown in a particular workspace.
Wave KPIs frequently asked questions
What is Wave KPIs used for?
Wave KPIs helps teams review supported business and operating metrics against monthly targets, with owners, charts, history, and discussion in one workspace.
What data sources can Wave KPIs use?
It offers catalogs for supported Wave tools and connected services. Options depend on the tools and integrations available in the workspace. Select a source in the KPI creation form to see its supported metrics.
Can I set a monthly target for each KPI?
Yes. The creation flow includes a monthly goal value and a condition, such as greater than or equal to or less than or equal to. The target also appears in the KPI’s detail view.
Can I edit KPI results manually?
The KPI History table displays source results as read-only values and supports editing dated goals. For recurring measures your team needs to record directly, review Wave Scorecards.
Does Wave KPIs show historical trends?
Yes. Report view includes a chart, comparison summaries, and monthly data. List view compares multiple KPIs across months, and the History tab shows dated goals and values.
Can I assign owners and organize KPIs by team?
Yes. Individual KPIs have owners, while groups have an owner and team associations. Group details also provides an owner breakdown.
How is Wave KPIs different from Wave Scorecards?
Wave KPIs selects metrics from supported data sources. Wave Scorecards supports recurring measures and checks defined for the team’s review process. Both provide ownership and targets, but the way results enter the workflow differs.
Is the video showing real customer information?
No. It uses actual Wave UI components with fictional teammates, metrics, targets, observations, and notes in an isolated sample workspace.
Bring your performance review into Wave
Wave KPIs connects the number, the goal, the owner, and the explanation. Build a focused KPI group, choose the available source metrics that matter to your team, and make the next review easier to act on.
Get started with Wave or explore the workspace at ourwave.io.


