
Wave Data Sheets brings structured information and team coordination into the same workspace. Build a table around the way your team works, add owners and dates, calculate values, collect requests through a form, and switch to a board, Gantt chart, or calendar when you need a different perspective.
A launch tracker is a good example. The team needs to know what is being delivered, who owns it, when it should be ready, and which items need attention. Wave Data Sheets gives that information a shared home, with views and tools that help people act on it.
Watch the Wave Data Sheets showcase
This 48-second showcase uses the actual Wave Data Sheets interface components with fictional sample data. Northstar Studio, its teammates, deliverables, dates, and budgets are illustrative. The video is a guided visual tour, not a demonstration of live multi-user editing or a production form submission.
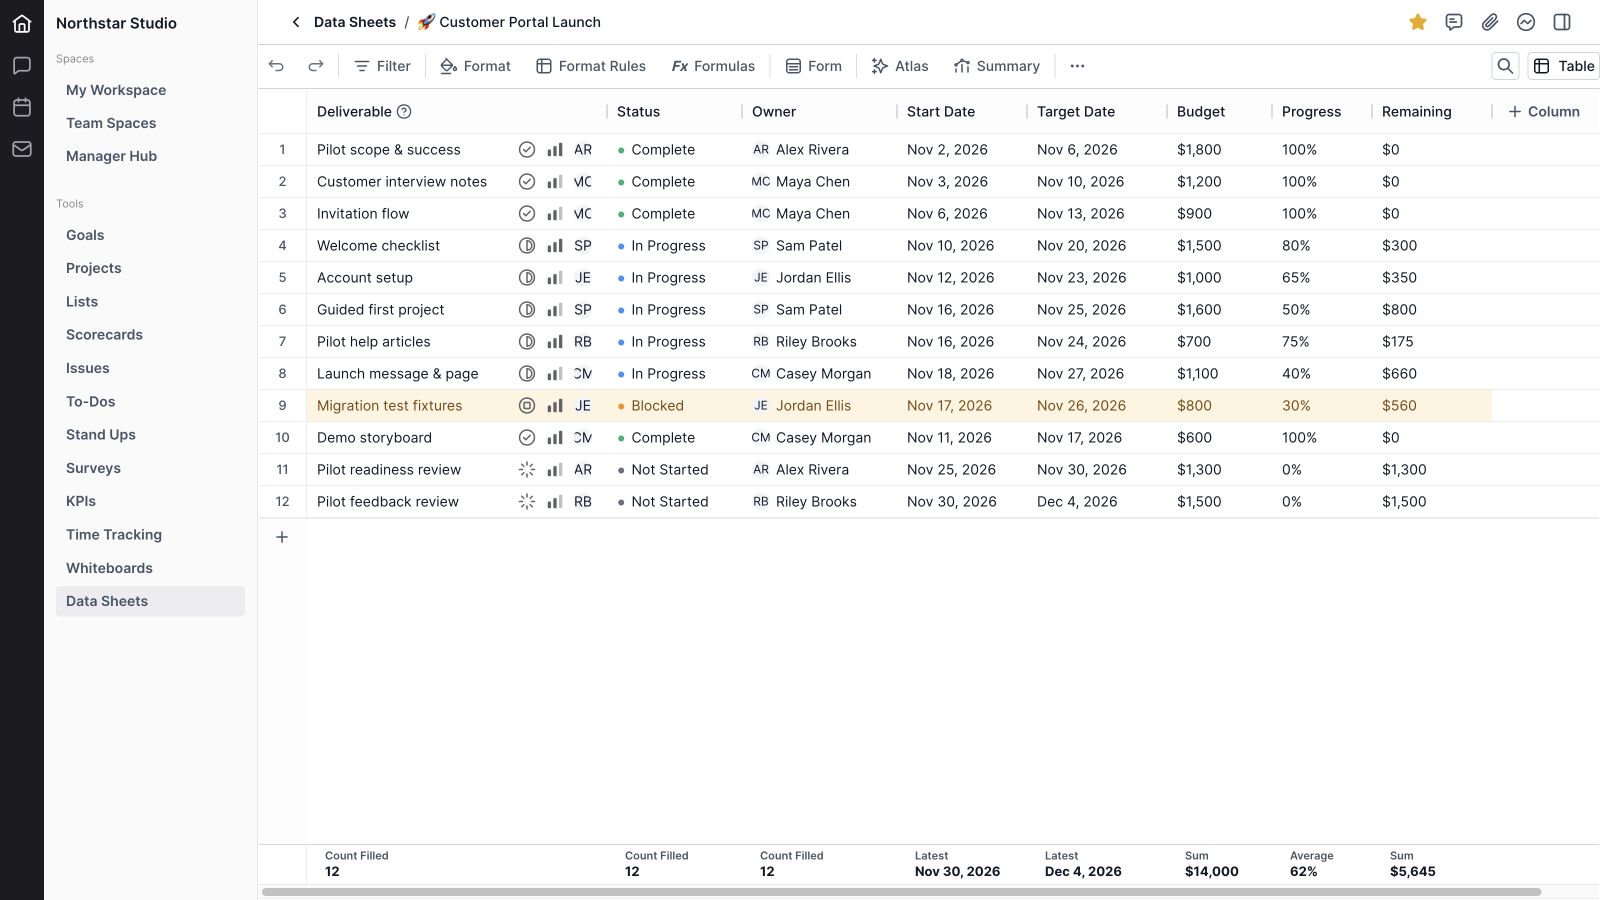
The sample workspace contains six sheets and 52 records. The main sheet, Customer portal launch, follows 12 deliverables across eight columns. It includes six dependency links, a five-question intake form, and a formatting rule that highlights blocked work.
What is Wave Data Sheets?
Wave Data Sheets is Wave’s tool for organizing structured records, doing spreadsheet-style calculations, and viewing the same information in different ways. It can support a feedback register, launch plan, content calendar, experiment backlog, onboarding tracker, vendor review, or another workflow that needs more structure than a document.
Each sheet has its own title, team context, ownership, status, and priority. Inside the sheet, configurable columns describe each record. Row-level work properties add another layer for coordinating responsibility and progress. Forms can collect new information, while comments and updates keep the surrounding discussion close to the data.
Organize the workspace around the work
1. Create named sheets with team context
Start with a descriptive title and select the relevant teams. An emoji gives the sheet an additional visual identity. Name sheets after a real workflow, such as Pilot feedback register or Customer onboarding tracker, so people can recognize their purpose before opening them.
2. Set sheet ownership, status, priority, and start date
The sheet itself can have an owner, status, priority, and start date. These properties describe the overall initiative. They help distinguish a high-priority launch tracker from a routine reference sheet and give teammates a clear person to contact about the sheet.
3. Keep frequently used sheets in favorites
Favorite cards put recurring work near the top of the Data Sheets library. The demo favorites the customer portal launch and pilot feedback register. That makes the two sheets supporting the current launch easy to revisit without searching the full list.
4. Search and filter the sheet library
Use the library’s search and property filters to narrow the sheets you are looking at. The list shows useful context such as health, priority, owner, start date, and status. Favorites and display controls help keep the library practical as more teams add their own trackers.
5. Open sheet details and progress breakdowns
The details drawer brings together sheet properties, row and column counts, view counts, and created and updated dates. Progress information and breakdowns by assignee, status, and priority summarize the row-level work properties. Use these to understand the scope of the sheet before reviewing individual records.
6. Share a sheet reference and manage its lifecycle
Copy the sheet URL or ID when referencing it elsewhere in your workspace. Rename a sheet as its purpose evolves, archive work that is no longer active, and use the available deletion controls when appropriate. A copied sheet link remains subject to the recipient’s access to Wave.
Build a useful table, then keep it easy to maintain
7. Work in Table or Grid view
Table and Grid provide spreadsheet-style ways to inspect and edit records. The primary text column identifies each row and can be renamed to match your workflow. In the sample launch tracker, it is called Deliverable, with supporting columns for status, owner, dates, budget, progress, and remaining planning allocation.
8. Add, duplicate, reorder, and remove rows
Grow the sheet as work arrives, duplicate a record when it provides a useful starting point, and rearrange rows to keep related information together. Row selection supports working with multiple records. Give each row one clear meaning so that filtering, formulas, and alternate views stay understandable.
9. Coordinate rows with status, priority, and assignee
Rows have work properties for status, priority, and assignee, available beside the primary cell and in related views. These support board grouping and progress breakdowns. A custom Status or Member column is separate from those row properties; use the appropriate control for the view you want to organize.
10. Add and configure columns
Choose a column type, give it a meaningful name, and add a description when teammates need guidance. The column picker includes text, numbers, choices, dates, people, files, ratings, references, and system fields. A small set of well-defined columns usually makes a better starting point than an oversized tracker.
11. Arrange the sheet for readability
Resize and reorder columns, hide fields that are not useful for the current view, and use the available pinning and sorting controls to keep important information in reach. Put the record’s identity and its most useful operational fields near the beginning of the table.
12. Search and filter records
Search inside a sheet to find a specific deliverable or other visible value. Column filters narrow the current records by selected values. A launch owner might focus on one teammate’s work or a particular status before moving to a wider review of the full sheet.
13. Select cells and move with the keyboard
Cell and range selection make it possible to work across a section of the sheet. Keyboard navigation and editing controls reduce repeated clicking during data entry. The selection summary provides a quick way to inspect counts and numerical aggregates for the cells being considered.
14. Copy, paste, and fill data
Clipboard actions and fill interactions help with repeated values and structured blocks of data. Formula references can adjust as formulas are copied or filled into another position. Review a small sample after a large paste, particularly when the destination contains typed columns or calculated values.
15. Undo and redo edits
Undo and Redo support correcting recent changes while working in the sheet. They are useful during ordinary editing and experimentation with the layout. Treat these controls as editing aids; they are not a separate, browsable version-history archive.
Choose fields that fit the information
16. Capture short text and longer descriptions
Text and Long Text fields cover names, notes, descriptions, and explanations. Keep the primary column concise enough to recognize in every view. Put supporting detail in its own field so that the board and calendar remain scannable while the table retains the context.
17. Store numbers, currency, and progress
Use numeric fields and display formatting for quantities, budgets, and percentages. Progress provides a dedicated way to show completion. In the demo, budget and calculated remaining values use currency formatting, while progress values run from 0% to 100%.
18. Add dates, checkboxes, and yes/no answers
Date fields provide the scheduling information used by calendar and timeline views. Checkbox and Yes/No fields work well for simple checks such as approval received or evidence attached. Give each field a precise definition so that a checked box means the same thing to everyone.
19. Use structured choices and statuses
Select, Multi-select, Status, and Picture Choice fields turn open-ended entries into defined options. Use one choice when a record should belong to a single category, and multiple choices when several labels can apply. Picture choices add a visual way to distinguish options.
20. Collect ratings and scale responses
Ratings, Symbols, Net Promoter, and Opinion Scale fields support more expressive input than plain text. They can help organize feedback and review criteria. These fields capture the values; define your scoring method separately rather than assuming that selecting a scale creates a complete analytical report.
21. Add files and contact-oriented fields
Files & media, URL, Email, Phone, and Place columns keep supporting material and practical reference information with the record. A vendor review could include a website and proposal file, while an onboarding tracker could hold a contact address and location.
22. Reference people, companies, contacts, and projects
Member, Company, Contact, and Project fields let you choose relevant records from Wave. These references add recognizable context to a sheet without relying only on free-form names. The options available depend on the records and access in your workspace.
23. Show who created or last edited a record
Created time, Last edited time, Created by, and Last edited by fields surface record metadata. They are useful when reviewing recently added feedback or identifying the origin of an entry. These system fields provide context alongside the content of the row.
Make the data readable and useful
24. Format cells and numbers
The Format controls support text styling, font size, text and fill colors, alignment, wrapping, and number presentation. Use currency, percentage, decimal precision, and grouping where appropriate. Consistent formatting makes the meaning of a figure clearer without changing the underlying workflow.
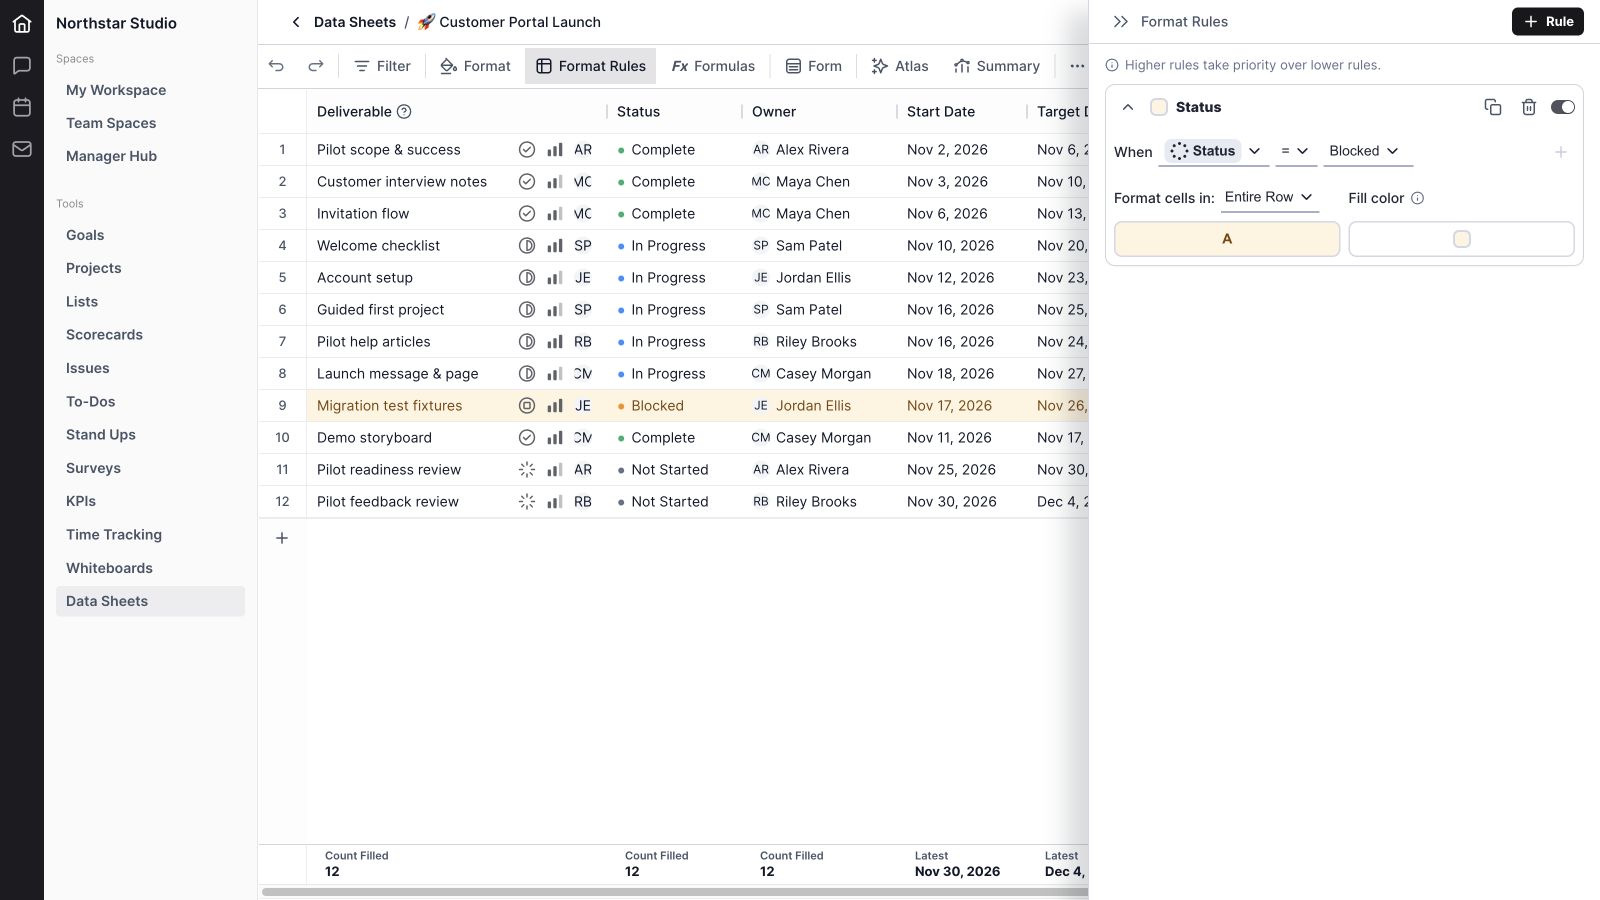
25. Highlight exceptions with formatting rules
Format Rules apply visual styling when a condition matches. Conditions depend on the field type and include comparisons, text matches, blank checks, checkbox states, and file presence. Apply the result to the matching cell or its entire row. Rules can be enabled, duplicated, reordered, or removed; the current editor uses one condition per rule.
In the launch example, a rule highlights the Migration test fixtures row because its custom Status field is Blocked. The warm background makes the exception visible during a quick table review.
26. Write formulas with cell references
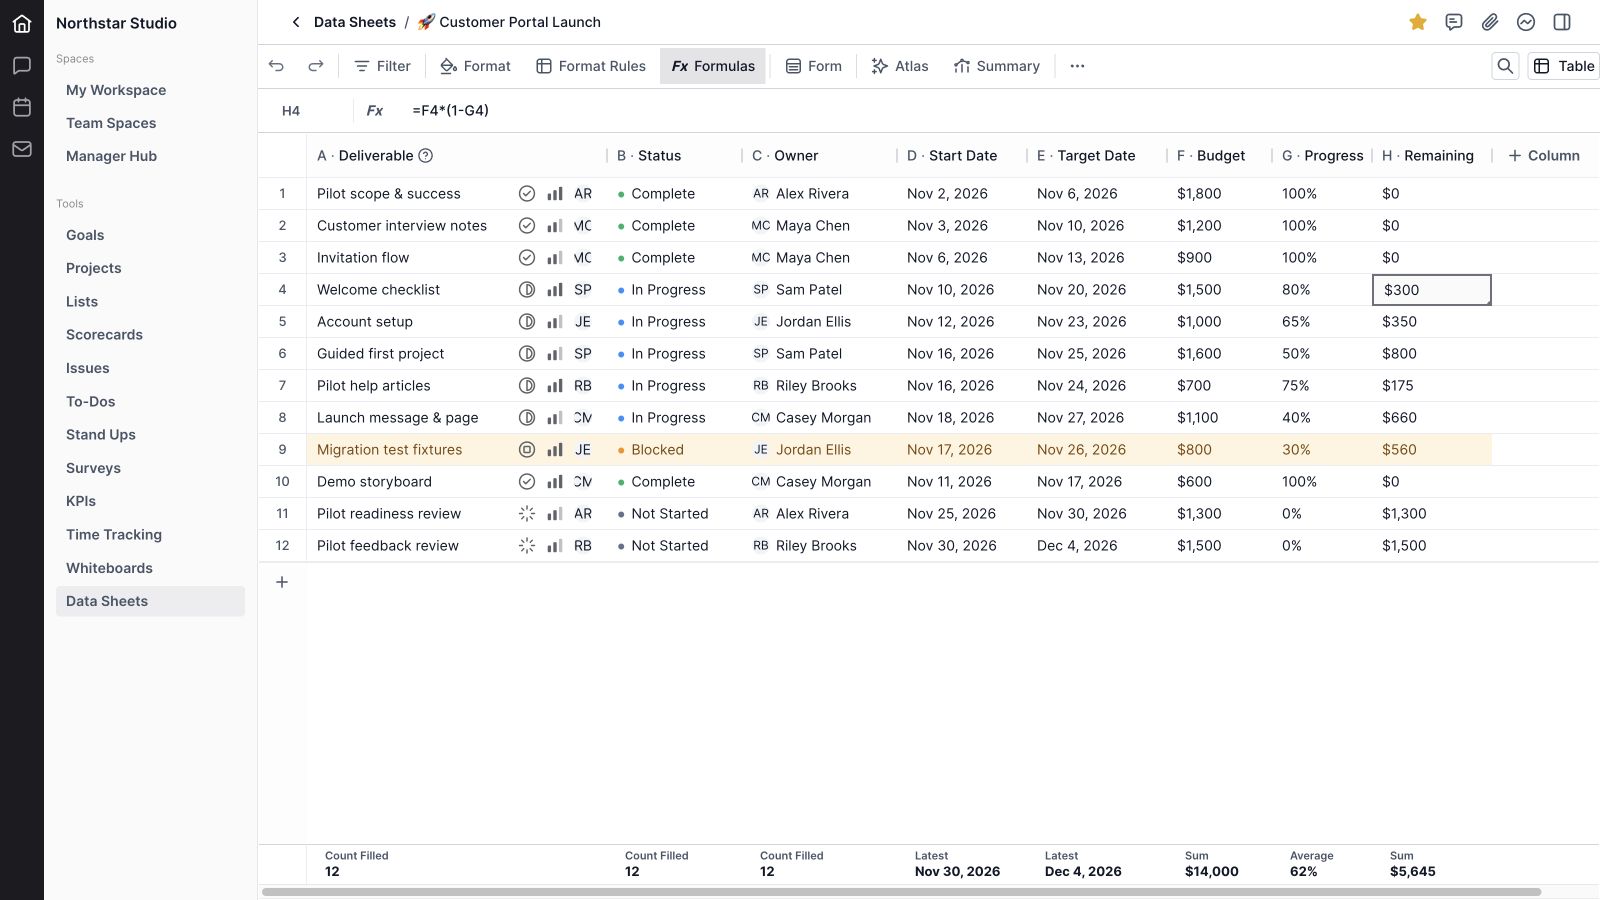
Open Formulas to inspect or edit an expression for the selected cell. Formulas start with an equals sign and support A1-style cell references, ranges, arithmetic, and absolute-reference notation. The formula bar keeps the expression visible while the cell shows its calculated result.
27. Use calculation, condition, and criteria functions
Supported functions include SUM, AVERAGE, MIN, MAX, COUNT, COUNTA, IF, IFERROR, ROUND, ROUNDUP, ROUNDDOWN, and ABS. Criteria-based calculations include COUNTIF, SUMIF, AVERAGEIF, COUNTIFS, SUMIFS, and AVERAGEIFS. The formula engine reports invalid or unsupported expressions and detects circular references. Check the functions you need before moving a complex workbook into the tool.
28. Summarize columns with the table footer
The table footer offers aggregations appropriate to each column, such as counts, sums, averages, and date summaries. In the sample, the footer totals $14,000 of planned budget and $5,645 of remaining planning allocation. The average progress is approximately 61.7%, displayed as 62% with the selected formatting.
The Remaining formula is budget multiplied by one minus progress: for row four, =F4*(1-G4) calculates $1,500 × (1 − 80%) = $300. This is an illustrative planning calculation, not actual expenditure, an accounting balance, or a forecast. The working table footer is separate from the toolbar’s Summary action, which is currently marked coming soon.
View the same work from another angle
29. Group records on a board
Board view organizes rows into columns using their work status, priority, or assignee. Grouping by assignee makes responsibility easy to review; grouping by status supports a progress conversation. The demo shows owner groups for Riley, Casey, and Sam, each with two launch deliverables.
30. Move cards between groups
Dragging a card between board groups updates the corresponding row-level work property. Use this to change an assignee or move work through its status groups. Remember that these properties are distinct from similarly named custom columns in the table.

31. Plan dates in Gantt view
Gantt places records against a timeline using schedule dates. Change the timeline scale, inspect overlapping work, and move or resize scheduled bars to adjust their dates. The row list stays alongside the schedule, helping the team connect each bar to a recognizable deliverable.
32. Connect dependent work
Dependency links make predecessor and successor relationships visible on the Gantt chart. The sample connects the pilot scope, interview notes, invitation flow, welcome checklist, guided first project, and readiness and feedback reviews. Use the links to explain sequence; automatic downstream rescheduling and critical-path calculation are not demonstrated or promised here.

33. Review records on a calendar
Calendar view places records on the date field you choose. The launch demo uses Target Date, showing the November delivery schedule and the final feedback review in early December. Choosing a different available date field changes the question the calendar helps answer.
Collect requests through a connected form
34. Map form questions to sheet columns
The form builder turns the sheet’s structure into an intake experience. Questions map to columns, keeping incoming answers aligned with the records the team will manage. The sample asks for a deliverable, a lead, a start date, a target date, and a planning budget.
35. Configure and arrange question steps
Add and reorder steps, edit the mapped column’s name and description, and configure the available answer settings for its type. Mark questions required when the answer is necessary to process the request. Keep optional fields optional so the form asks only for information the team will use.
36. Customize welcome, completion, and imagery
Welcome and end screens frame the form with a title, description, and configurable finishing experience. Images and their positioning controls can add context to questions and screens. Use the welcome screen to explain what belongs in the form and the end screen to tell respondents what happens next.
37. Preview the form on desktop and mobile
Desktop and mobile preview controls help you review the respondent experience before sharing. Test the wording, question order, and required answers. Preview completion is separate from a real response submission, which makes it useful for checking the flow without adding a production record.
38. Publish and share a form link
Share Link prepares the form for public response access and provides its link. The sharing flow also supports link-preview information such as a title, description, and thumbnail. Review which questions and details are included before sharing a public intake form; publishing a response form does not mean giving respondents access to edit the full sheet.
39. Bring submitted responses into the sheet
Completed form responses feed the connected Data Sheet so the team can review the incoming information in its existing workflow. The next step might be assigning responsibility, checking scope, or choosing dates. Use a real submission to verify your own end-to-end intake process before distributing the form broadly.

Bring existing information in and keep collaboration nearby
40. Import CSV and Excel data with a preview
The Import action accepts CSV and XLSX files and provides a preview of the proposed columns and rows before confirmation. For XLSX, the current importer reads the first ordinary worksheet rather than importing every tab in a workbook. Review headers, inferred field types, dates, and formulas before committing an import.
41. Export a sheet to Excel
The Export action downloads an XLSX workbook. The export path includes column headers, cell values, supported formulas, and spreadsheet formatting information, with Wave metadata used by its importer. Do not assume that forms, dependency links, formatting rules, or every feature of another spreadsheet product will survive a complete round trip.
42. Keep comments, attachments, and updates with the sheet
Header actions open sheet comments, attachments, and updates. Use comments and replies for discussion, attach supporting material, and post a health update when teammates need the broader picture. The details area also provides activity context. This keeps the explanation for a change close to the information being reviewed.
43. Work with shared updates and cell presence
Wave Data Sheets includes real-time update handling and cell-presence indicators for shared work. These help teammates see changes and understand where others are working. Availability depends on the connected workspace and session; the showcase uses isolated sample data and does not simulate a live collaboration session.
44. Bring sheets into meeting agendas and open Atlas
A Data Sheets agenda view can bring a selected sheet into a Wave meeting, giving the team a shared reference during discussion. The sheet toolbar also offers an Atlas entry point. The showcase does not claim automatic analysis, generated formulas, or AI-written summaries from that button.
A practical way to start with Wave Data Sheets
- Choose one repeatable workflow. Start with something the team already reviews, such as launch readiness or incoming feedback.
- Define what one row represents. In the demo, one row is one deliverable. Avoid mixing deliverables, people, and weekly totals as interchangeable rows.
- Add the fields needed to make decisions. Begin with identity, ownership, state, and dates, then add supporting numbers and references.
- Pick the view for the conversation. Use the table for detail, a board for ownership or status, Gantt for sequencing, and a calendar for dates.
- Make exceptions easy to notice. Add a clear formatting rule and useful footer calculations.
- Use a form when information arrives repeatedly. Test the questions and one real response before sending the link to your audience.
Wave Data Sheets works alongside Wave Projects for project execution, Wave Meetings for team reviews, and Wave CRM for customer relationships. A sheet is useful when your workflow needs a custom structure; a dedicated tool may already provide the process you need.
Wave Data Sheets frequently asked questions
What is Wave Data Sheets used for?
It is used to organize structured records, calculate values, and coordinate information with a team. Examples include launch trackers, feedback registers, experiment backlogs, content calendars, onboarding trackers, and vendor reviews.
Which views are available in Wave Data Sheets?
The current view menu includes Table, Board, Grid, Gantt, and Calendar. These provide different ways to work with the same sheet. Forms are accessed through the Form action rather than as another item in that view menu.
Does Wave Data Sheets support formulas?
Yes. It supports cell references, ranges, arithmetic, conditional calculations, rounding, and aggregate and criteria functions. The supported function set is narrower than a complete Excel implementation, so check important formulas before migrating a workbook.
Can I collect responses with a form?
Yes. Build questions mapped to columns, configure required answers, preview the flow, and share a published response link. Submissions feed the connected sheet. The video shows the builder with sample questions rather than a live public submission.
Can I import and export spreadsheets?
Import accepts CSV and XLSX, while the Export action produces XLSX. The current Excel import uses the first ordinary worksheet. Review the preview and check the result, especially for complex formulas or features that do not have a direct equivalent.
Do boards use my custom Status column?
Board grouping uses row-level work properties for status, priority, or assignee. A custom Status or Member column is separate. Keep those distinctions clear when designing a tracker so edits affect the intended field.
Can Wave Data Sheets summarize my information?
Formulas, selection aggregates, and table-footer calculations can summarize values. The separate Summary toolbar action is currently marked coming soon and should not be treated as a working reporting feature.
Is the data in the showcase real customer information?
No. The video uses actual Wave interface components with fictional teammates, records, dates, and budgets. Its calculations illustrate one possible workflow; they do not report customer activity, company spending, or product performance.
Build a shared home for your team’s information
Start with a useful table, then give the team the views, calculations, and intake process that make it easier to use. Wave Data Sheets brings those pieces into the workspace where the team already coordinates its work.
Get started with Wave, explore the Wave product, or contact the team to discuss your workflow.
Feature review: November 18, 2026. This guide reflects the inspected interface and implementation. Some capabilities depend on workspace access and configuration.


