Articles
Mar 11, 2026
What Is an Accountability Chart?
Define roles clearly to drive accountability and performance
Define roles clearly to drive accountability and performance

If you’ve ever said:
You don’t have a people problem.
You have an accountability problem.
As companies grow, role clarity becomes harder. Titles multiply. Reporting lines blur. Responsibility overlaps. Work gets done, but ownership becomes fuzzy.
That’s where an Accountability Chart comes in.
In this article, we’ll cover:
An Accountability Chart is a structural framework that defines roles and responsibilities in an organization based on function and ownership, not hierarchy or titles.
Unlike a traditional org chart, which focuses on reporting relationships, an Accountability Chart focuses on:
At its core, it answers three critical questions:
Notice the emphasis on accountable, not just responsible.
In an Accountability Chart, each major responsibility has one clear owner.
Not two.
Not three.
One.
The concept of defining roles by function rather than title has existed for decades, but it became widely popularized through the Entrepreneurial Operating System framework created by Gino Wickman in the book Traction.
In EOS, the Accountability Chart replaced the traditional organizational chart for scaling businesses.
The reasoning was simple:
Traditional org charts create politics and ego.
Accountability Charts create clarity and execution.
Instead of asking:
“Who reports to whom?”
EOS asks:
“What does the business need?”
This shift reframed organizational design around outcomes rather than hierarchy.
Since then, variations of Accountability Charts have been adopted across scaling frameworks, including principles found in Scaling Up by Verne Harnish.
The idea is consistent:
Clarity of ownership drives performance.
This distinction matters.
It answers: Who reports to whom?
It answers: Who owns what?
In growing companies, the second question is far more important.
You can have a perfectly structured org chart and still have confusion about ownership.
An Accountability Chart removes ambiguity.
A well-designed Accountability Chart typically includes:
Most small and scaling companies include functions like:
The key is not copying another company’s structure.
It’s identifying what your business specifically requires to win.
Each function contains defined roles.
For example, under Sales you might have:
Each role has clearly defined outcomes.
Not task lists.
Not job descriptions.
Outcomes.
This is critical.
Each role should have 3 to 5 major accountabilities.
Example:
Head of Sales may own:
If someone cannot clearly articulate their top responsibilities, the structure is too vague.
Shared ownership is often disguised as collaboration.
But shared accountability usually means no accountability.
Every seat on the Accountability Chart must have:
One person ultimately accountable.
Collaboration is encouraged.
Ownership is singular.
Early-stage startups often operate informally.
Everyone does everything.
But as you grow:
Without clarity:
An Accountability Chart creates:
It reduces friction and speeds execution.
Here’s where many companies go wrong.
They build it once and never revisit it.
Or they design it around current people instead of future needs.
Here are best practices to get it right.
Start with structure.
Then assign people.
Not the other way around.
Ask:
If we were building this company from scratch today, what functions would we need?
This future-focused mindset prevents you from protecting inefficiencies.
Avoid task lists.
Focus on measurable outcomes.
Instead of:
“Manage social media.”
Define:
“Generate qualified marketing pipeline.”
Outcomes clarify expectations.
If a seat has 12 accountabilities, it’s unclear.
Keep it tight:
3 to 5 major outcomes per role.
Clarity beats completeness.
As your company evolves, so must your structure.
Ask quarterly:
An Accountability Chart is not static.
It evolves with growth.
Someone can report to one leader while owning responsibilities that impact multiple teams.
Focus on outcomes first.
Hierarchy second.
Here are the most frequent breakdowns.
You protect current team members instead of designing optimal structure.
Two owners for one outcome almost always creates confusion.
A “Director” title does not define accountability.
Accountability without measurable KPIs is incomplete.
A stale chart reflects a stagnant structure.
The most powerful Accountability Charts do not exist in isolation.
They connect directly to:
Ownership should link to measurement.
If a role owns revenue growth, revenue metrics must live directly alongside that seat.
That connection transforms structure into performance.
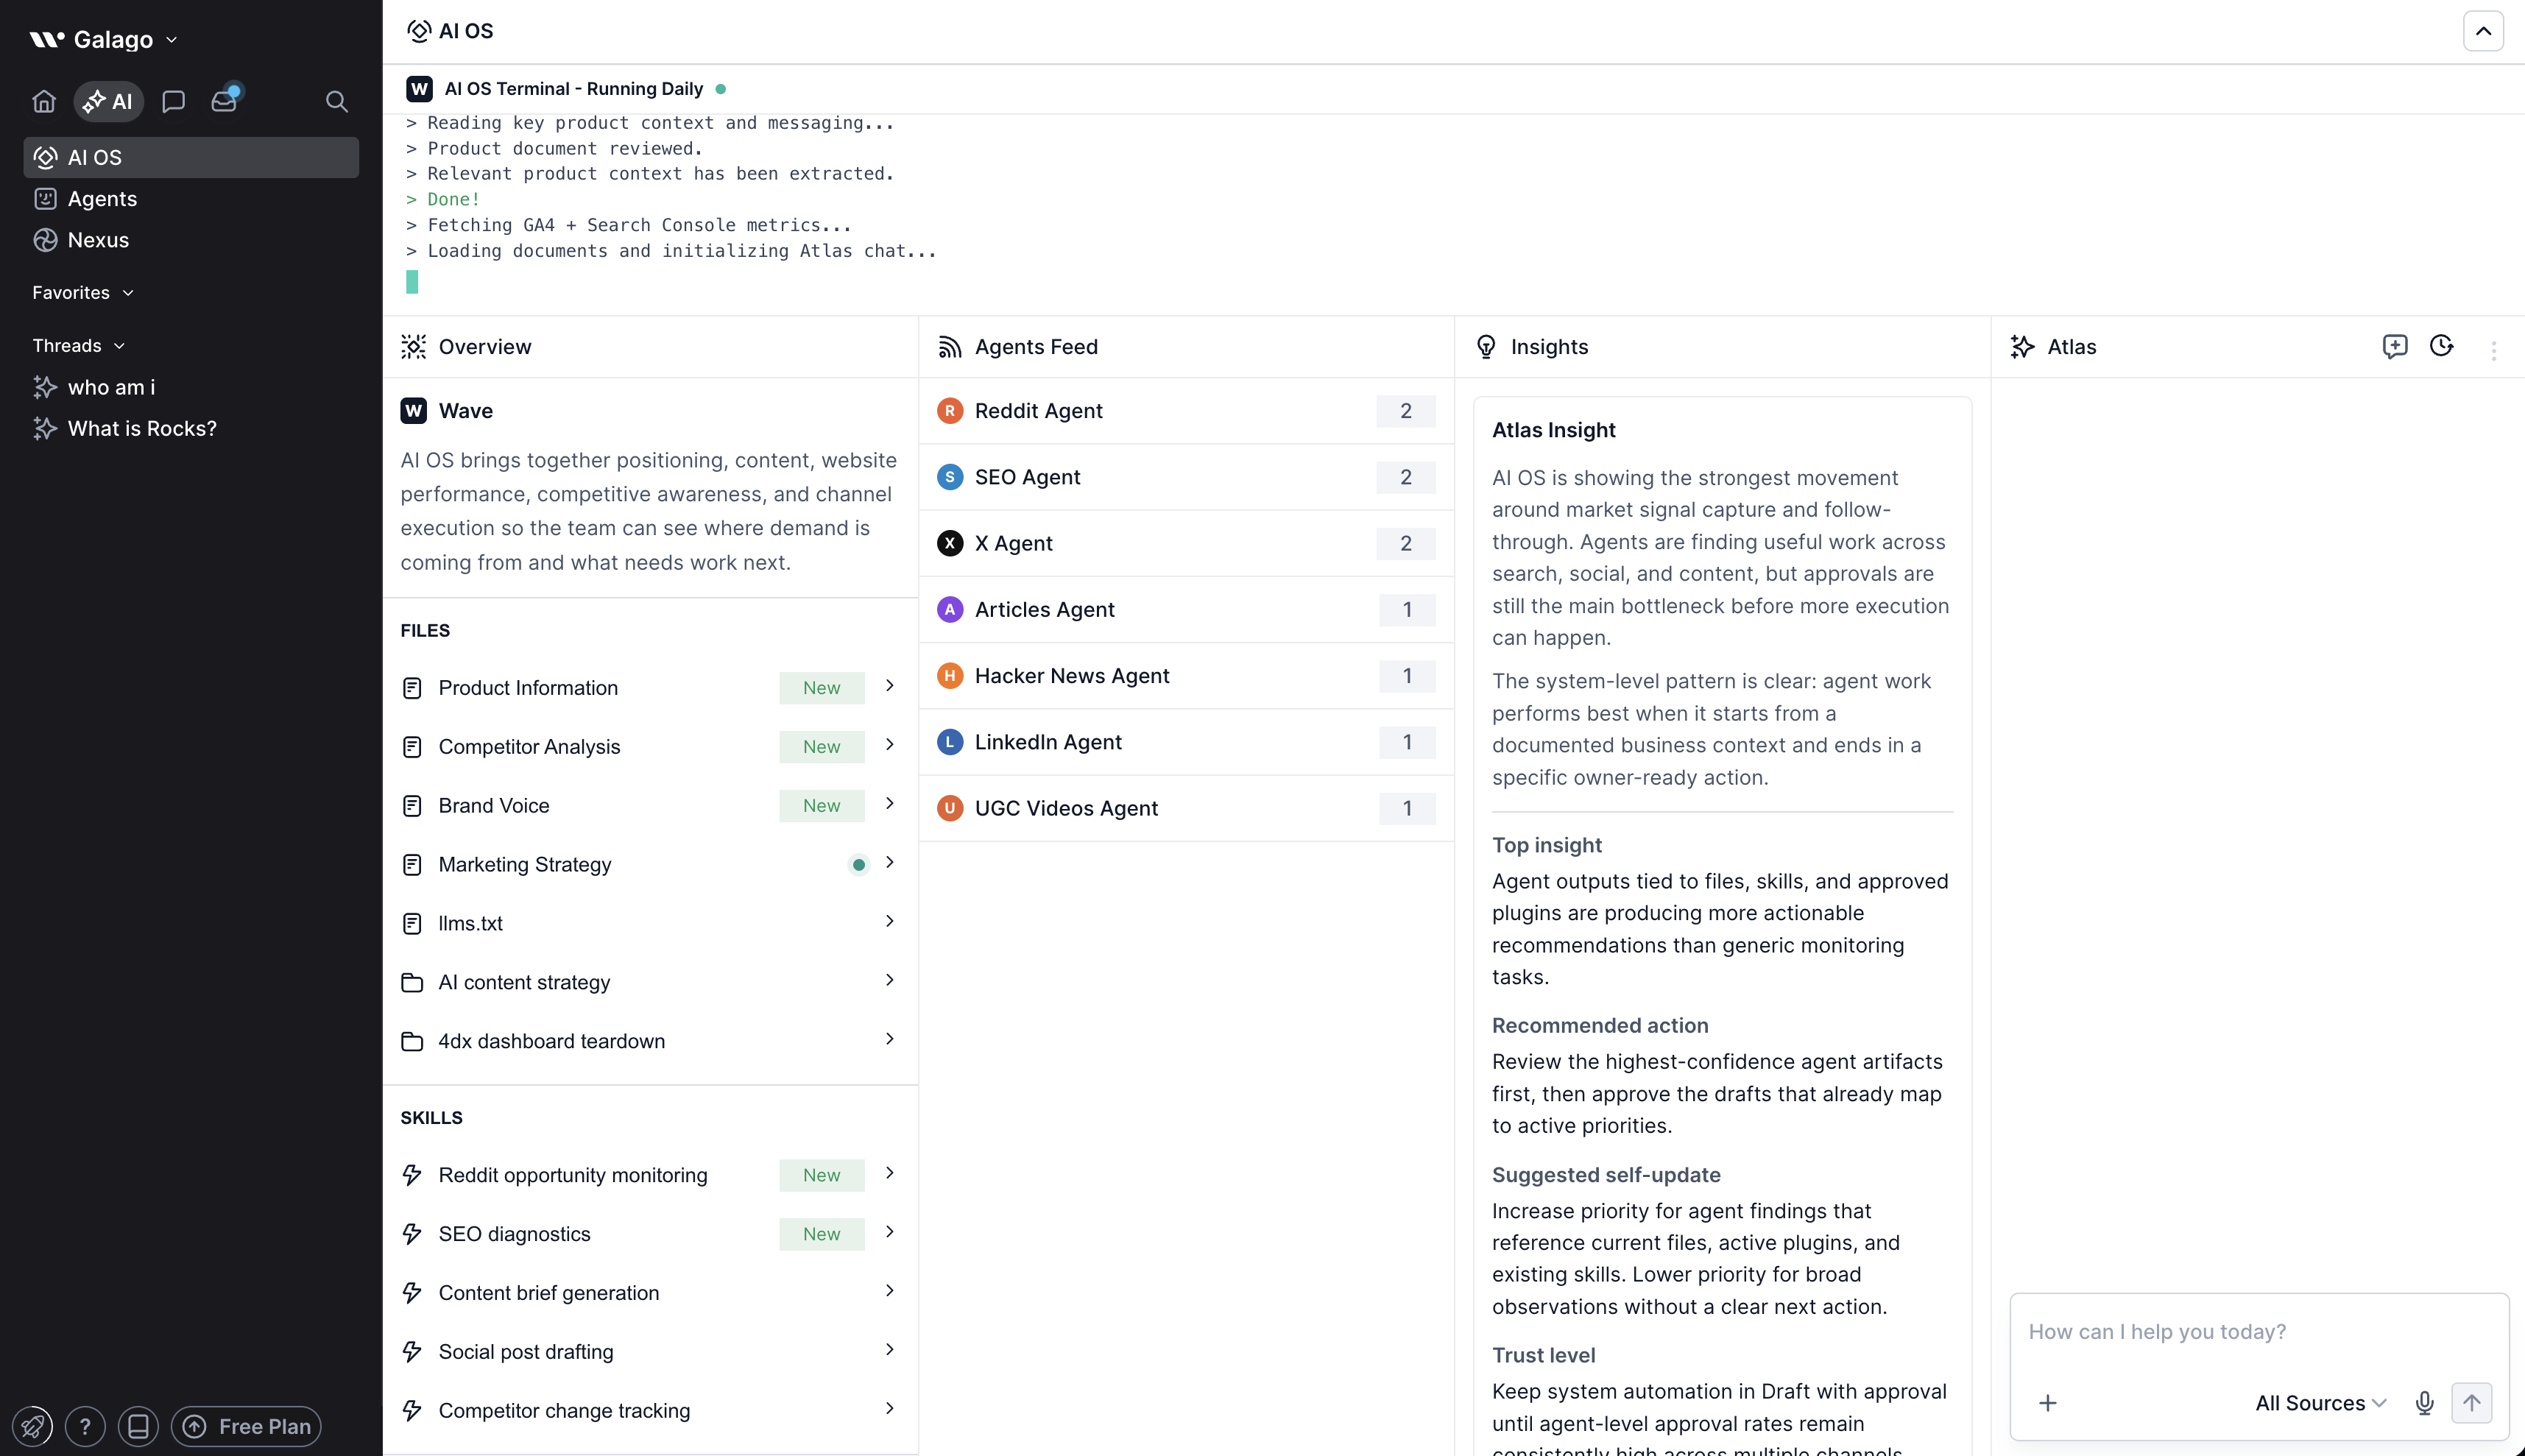
Many companies build an Accountability Chart in a slide deck and forget about it.
Wave turns it into a living execution layer.
Here’s how.
Instead of static structure, you get operational clarity.
That’s where execution accelerates.
An Accountability Chart is not just an organizational tool.
It is a clarity engine.
It forces you to answer:
When roles are clear, decisions move faster.
When ownership is singular, performance improves.
When structure reflects strategy, growth becomes sustainable.
If your company is growing and role confusion is creeping in, it may be time to formalize your Accountability Chart and connect it directly to execution.
Ready to bring clarity to your team’s roles and responsibilities?
See how Wave helps you design, connect, and operationalize your Accountability Chart for scalable growth.